Methods
The following describes the general methodology employed to develop the 2020 U.S. University Report Card. All elements of the evaluation, including selection of universities, selection of metrics, data collection, scoring and grading, were conducted by Universities Allied for Essential Medicines (UAEM) between May 2014 and January 2021. For the full methodology please click here.
SELECTION OF UNIVERSITIES
For this third iteration of UAEM’s U.S. Report Card project, we limited our evaluation to the top 60 American universities that attracted the highest levels of funding from public biomedical research funding agencies. This enabled us to focus on institutions that were likely to be major drivers of academic medical innovation, were more likely to be analogous and therefore yield meaningful comparison on key metrics. We chose to focus solely on American universities in this second iteration, as there are important differences between Canadian and American universities that will be best addressed by conducting separate evaluations. UAEM students in Canada are currently planning a distinct report card focusing solely on evaluation of Canadian universities.
In 2013 and 2015, UAEM used publically available figures from the US National Institutes of Health (NIH) (RePORTER) and the National Science Foundation (NSF) (NCSES Data) to select the top U.S. institutions that received the highest total grant funding dollar amount from the NIH and the NSF during FY 2010-2012. In order to select the final list of universities for evaluation for this iteration, the total NIH funding received by universities between 2014-2016 was added to the total NSF funding received by universities within that same time period. At the time data was collected funding totals for 2017 forward was unavailable. Schools for which NSF funding data for 2014-2016 was unavailable were excluded from evaluation.
In an effort to track changes in schools over time, we decided to keep the same list and added an additional school to round the total number of universities to 60. The new school is Oregon Health and Science University.
SELECTION OF EVALUATION METRICS
While there are variations across the universities selected for evaluation (e.g. in levels of research funding, student body size, public vs. private institutions), we have selected evaluation criteria intended to minimize the impact of such variations.
Importantly, all metrics that analyze continuous variables account for variation in school size and funding by normalizing the absolute number to the overall level of combined NIH and Gates funding. For example, when evaluating a university’s investment in neglected disease research, our metric is calculated by dividing a given institution’s overall medical research funding devoted to ND research projects (from the >100 funding sources included in the G-Finder report) by the total NIH plus Gates funding to generate an “ND Innovation Index”. This enabled us to adjust for confounding by institutional size and allowed for a meaningful comparison of performance across institutions.
For categorical metrics, we developed pre-defined sets of discrete categories by which all universities can be uniformly evaluated, and for which performance was likely to be independent of variation in university size, funding, capacity or resources.
NOTE: Specific information on each evaluation metric’s significance, data source, and potential for university improvement can be found in the detailed data “pop-outs” for each institution listed in the left hand column.
To view this detailed information, simply mouse over over the “?” symbol located in the upper right corner of each question box.
Overall Data Quality and Reliability Considerations
A critical aspect of the Report Card methodology is the collection and analysis of data using two broad categories of data extraction:
- Data obtained by accessing publicly available sources, such as university websites, online grant databases, and search engines; these data were collected by UAEM members, staff, and interns
- Data obtained by self-report of university officials in response to survey instruments designed and provided by UAEM
We attempted to maintain rigor and minimize biases by systematically collecting and analyzing data according to detailed, predetermined standardized operating procedures (SOPs).
For CATEGORY 1 (PUBLIC DATA), we address data quality and consistency as follows:
- We prospectively developed SOPs and standardized data entry forms, including uniform search terms to which all investigators were required to adhere
- We performed quality control tests to ensure that investigators were obtaining the same results from the collection procedures
- Where possible, multiple individual investigators independently and concurrently performed the same data collection and search processes to ensure consistency of data
For CATEGORY 2 (SELF-REPORTED DATA), we address data quality and consistency, including concerns about questionnaire non-response, as follows:
- Compared to the first iteration of the Report Card, we chose to reduce the number of questions we asked of administrators if answers could be easily verified via public sources by our team of investigators.
- We provided the same questionnaires to all institutions.
- We developed a standardized process for identifying and verifying contacts to receive questionnaires at each institution.
- We identified between 5 and 10 specific administrators in leadership positions at each university whom we felt were most likely to recognize the value of the surveys and would encourage a response from within their teams. The individual contact details were searched publically via the website and if not via the internal site via students at those institutions. Finally phone calls were made if the contact details could not be ascertained by these means The list included but was not limited to directors of technology licensing offices, deans of individual schools (law, public health, medicine), and vice presidents for research.
- We used standardized communication strategies to deliver the survey instruments to all institutions and conduct consistent follow up via e-mail; institutions were given at least 1 month to respond to all survey instruments, and each administrator was contacted a minimum of three times to encourage response.
- Where possible, we asked questions in a manner such that the variable under question was either dichotomous or categorical, rather than continuous; this was in an effort to maximize the likelihood of response from institutions.
- We applied standardized scoring of responses across all institutions.
- We measured and reported response rates both for the entire questionnaire and for individual questions.
- If more than one person per institution replied, and there was discrepancy in the responses, first we aimed to verify the correct answer via verified public sources. If this was not possible, we elected to use the answer that favored the university.
SCORING AND GRADING
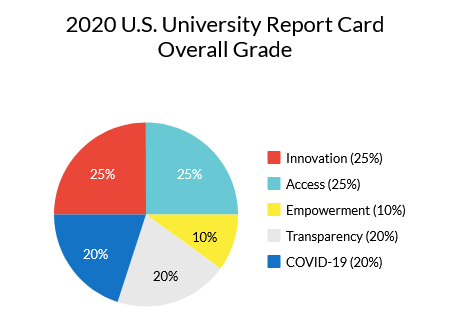
As in 2015 and given the purpose of the Report Card, greater weight was allocated to the Innovation and Access sections, with each section accounting for 25% of the total grade. The Empowerment section is worth 10% of the total grade due to the increased challenges in evaluating these specific metrics and the lack of a measurable correlation between these metrics and their impact on increasing access to medicines and addressing neglected diseases in low- and middle-income countries.
For each question, the institution was assigned a raw score from 0 to 5, based on the data that was gathered. Each question was also associated with a weighting multiplier from 0.25 to 2.5, based on the relative importance of each question as determined by UAEM’s report card team. The weighted score for a given question was the product of the raw score and the weighting multiplier. In an effort to minimize bias due to non-response to CATEGORY 2 (self-reported) questions, we have designed the Report Card such that each section is a mix of CATEGORY 1 (public data) and CATEGORY 2 (self-reported) questions.


Leave a Reply